Cyber Security News Aggregator
.Cyber Tzar
provide acyber security risk management
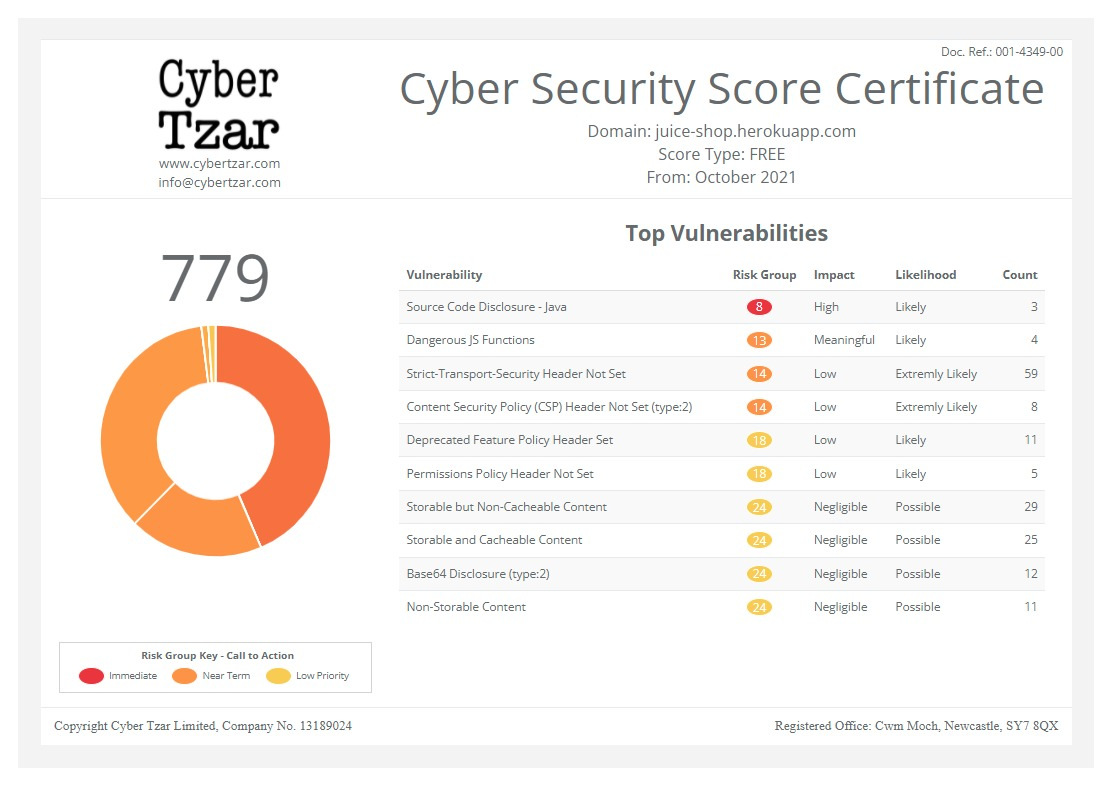
platform; including automated penetration tests and risk assesments culminating in a "cyber risk score" out of 1,000, just like a credit score.HikCentral Professional V2.4 is available now
published on 2023-08-07 08:21:39 UTC by Rebecca KnowlesContent:
HikCentral Professional is an integrated on-premises video management software from Hikvision, designed to meet versatile security challenges on one intuitive platform. The company launches two major updates every year and the latest 2.4 version is out now.
In the latest 2.4 version, Hikvision has not only included additional functionalities, but has also made improvements to the system’s ease of use for end users. This new version highlights six major improvements: usability, visualisation, professional applications, compatibility, flexibility, and system enhancements. More detailed information about the most significant and beneficial applications introduced in this version will follow below.
New Augmented Reality
Instead of using an E-map with all the cameras plotted on it, you can use a live stream from one of Hikvision’s Panoramic/PanoVu/TandemVu cameras to view a large area, such as a city centre, with other cameras superimposed on the image. From this screen, you can control, select, and view panoramic and PTZ channels.
For instance, as demonstrated in the picture below, if you use a TandemVu camera, you can simply draw a box around the area of interest – such as people or vehicles – and the PTZ channel will zoom in and, if set up correctly, begin tracking the object. You can bring up additional panoramic cameras in a list to view different parts of the city centre. Across one scene, multiple different cameras are plotted, allowing for real-time live viewing and alert management via the screen.
I am certain you’ll appreciate how powerful this solution is for live tracking vast areas. Imagine it’s akin to a scene from Tom Cruise’s movie, ‘Minority Report,’ where he searches for someone on a large, see-through touchscreen video wall, zooming in and out of an expansive scene.

Digital Dashboard
This is a digital dashboard complete with dynamic graphics, offering a more visually engaging way to navigate through the menus. It’s another method for simplifying the operation of such a powerful VMS system. For instance, you can view real-time vehicle parking space statistics, visitor statistics, and alarm security panel overviews.

Updated in-store business intelligence
Retail clients represent a large market for CCTV. By using our fisheye cameras, you can produce a comprehensive global heat map of an entire store layout. For example, it could reveal where customers go after they enter the store, the busiest and quietest areas, and how much time they spend in specific sections. This data could help measure the success of ongoing promotions or experiments with merchandising, such as placing higher-priced items in busy areas to monitor if dwell time decreases in those spots.
Moreover, the data collected is not limited just for people counting. By using our 7 line cameras, you can link EPOS transaction data with the number of customers entering the store each day. This can provide insights into how many customers merely browsed versus those who actually made purchases. Additionally, demographic data such as age and gender can also be collected, providing retailers with even more valuable insights.
Our queue management cameras allow retail clients to monitor queue lengths and service speed, enabling them to take proactive action to improve customer experience when queues become too long or slow.”

To enhance and simplify the setup process, we now provide options to select “Retail”, ensuring that all reports are relevant to retail operations, or “Public Mode”, which provides all various reports as previous version.

The most significant update for this module is the enhancement of the data dashboard. Users can visualise various data such as people counting, queue analysis, and heat maps, even across different floors. Retail clients often operate with limited budgets, and we can offer them valuable analytical data to help reduce their stock shrinkage and analyse customer behaviours.
This data can aid in improving customer service or increasing sales, potentially freeing up budgets from other departments. For regional store managers, HikCentral allows data to be auto-generated and emailed as a CSV file, eliminating the need to reach out to each individual store. From this file, they can analyse each store and compare it with others. Additionally, they have the ability to generate their own dashboard, displaying multiple stores for a quick view and more detailed comparisons.


Full features and modules from HikCentral Access Control 2.0
- Bluetooth and NFC technology are increasingly in demand for using mobile phones as access control credentials. With the HikCentral Professional App, the company’s hardware terminals fully support the use of either NFC or Bluetooth
- Self-Service Time & Attendance is a feature enhanced in this latest update. It’s designed to reduce the workload for HR and payroll teams by allowing employees to check their own recorded attendance via their HikCentral mobile app or web client. Additionally, it can be used to request time off for holidays. Depending on the size of a business, there may be multiple layers of approval required. HikCentral streamlines this process, enabling employees to track the status of their applications. This is particularly useful for those planning holidays who don’t want to risk losing a deposit if they’re unable to secure the time off. With HikCentral, they can have peace of mind knowing their request will be sent to the right person for approval
- A considerable amount of information is recorded, and to simplify matters, Hikvision has provided 37 preset reports that should cover most requirements, although more can be added. The goal is to make the process as straightforward as possible for both the installer and the end user.
https://securityjournaluk.com/hikcentral-professional-v2-4-available-now/
Published: 2023 08 07 08:21:39
Received: 2023 08 07 10:05:53
Feed: Security Journal UK
Source: Security Journal UK
Category: Security
Topic: Security
Views: 15
